Saturday, May 14, 2011

King Raises Inflation Forecast – Boosts the Pound

Mevyn King surprised and raised the long term inflation forecasts in the BOE Inflation Report. The report also states that GDP is better than reported. This boosts GBP/USD that broke above resistance. Update.
 

The governor of the BoE, Mervyn King, is usually pessimistic and his actions tend to weaken the British pound. This time is different. Contrary to the usual stance that inflation is fueled by fuel and food, and that it is temporary, the inflation report sees a long term rise in inflation. The two year horizon, long term no matter how you look at it, was raised to almost 2%.

This may sound low in the long term, but it’s significantly higher than the previous long term estimate of 1.6%. This change raises the chances of a rate hike sooner than later.

At the beginning of the week, there was talk that a downgrade of the growth forecasts would hurt the pound. The BOE indeed lowered the growth forecasts, but it wasn’t too bad. Growth is expected to be at around 3%, and there’s also a comment about official GDP figures being too low – this is very good for the pound.

It seems that the market focuses on inflation and improved chances of a rate hike in the near future. This goes hand in hand with the current optimism that replaced the gloomy mood at the end of the previous week and at the beginning of this one.

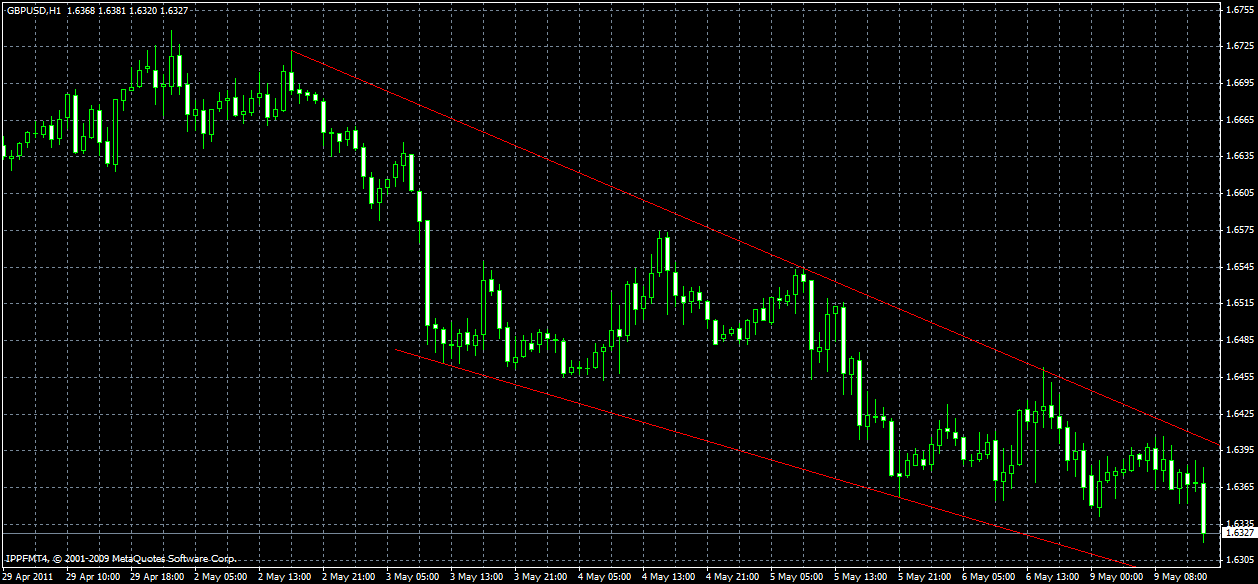
GBP/USD now trades just under 1.65, approaching the 1.6540 line. Levels above are 1.66 and 1.67. Below we find 1.6430 and 1.63.

Earlier today, the pound made significant gains on various factors. Greece is likely to receive another bailout package. While this may be a temporary solution, the markets like it, and it weakens the dollar across the board. In addition, there are talks that China might actually cut its interest rate, and this also triggers risk appetite, weakening the dollar. All this sent GBP/USD towards the 1.6430 resistance line.

Source: Forex Crunch

Read More......

Initial Jobless Claims in U.S. Fell 44,000 Last Week


The number of Americans filing first- time claims for unemployment insurance payments fell less than forecast last week, indicating recovery in the labor market is taking time to accelerate. 

Applications for jobless benefits decreased 44,000 in the week ended May 7 to 434,000, Labor Department figures showed today. Economists forecast 430,000 claims, according to the median estimate in a Bloomberg News survey. The number of people on unemployment benefit rolls rose, while those getting extended payments decreased. 

A further decline in the number of firings accompanied by job gains elsewhere may shore up consumers’ confidence and boost average incomes, helping Americans overcome the strains of higher food and energy costs. U.S. payrolls have expanded for seven straight months, a sign the labor market is strengthening. 

“These numbers are consistent with the consumer continuing to spend and the recovery continuing to gain traction,” said Conrad DeQuadros, a senior economist at RDQ Economics LLC in New York. “The only problem is that we’re digging out of a very deep hole in employment, so the unemployment rate will probably remain elevated.” 

Other reports today showed retail sales rose in April, reflecting gains at service stations and grocery stores, and wholesale costs rose more than forecast.

Treasuries Fall

Stocks and Treasuries fell after the reports. The Standard & Poor’s 500 Index declined 0.3 percent to 1,337.95 at 9:31 a.m. in New York. The yield on the benchmark 10-year Treasury note rose to 3.19 percent from 3.16 percent late yesterday. 

Estimates for first-time claims ranged from 400,000 to 465,000 in the Bloomberg News survey of 44 economists. 

The Labor Department initially reported the prior week’s applications at 474,000, elevated by events that seasonal variations failed to take into account. A spring break holiday in New York, a new emergency benefits program in Oregon and auto shutdowns caused by the disaster in Japan were the main reasons for the surge, a Labor Department spokesman said last week. 

A Labor Department official said today there was a significant increase for initial jobless claims in Alabama related to damage from the tornadoes and storms. The official said that figure did not affect the national numbers. 

The four-week moving average, a less-volatile measure, increased to 436,750 from 432,250, the highest since November. 

The number of people continuing to collect jobless benefits rose by 5,000 in the week ended April 30 to 3.76 million. Economists forecast the number would fall to 3.7 million. The continuing claims figure does not include the number of workers receiving extended benefits under federal programs.

Emergency Payments

Those who’ve used up their traditional benefits and are now collecting emergency and extended payments decreased by about 17,000 to 4.1 million in the week ended April 23. 

The unemployment rate among people eligible for benefits, which tends to track the jobless rate, held at 3 percent in the week ended April 30, today’s report showed. Thirty-one states and territories reported an increase in claims, while 22 had a decrease. 

Initial jobless claims reflect weekly firings and tend to fall as job growth -- measured by the monthly non-farm payrolls report -- accelerates. 

Federal Reserve Bank of New York President William C. Dudley said last week the recovery is falling short of the central bank’s goals even with job gains. 

“Economic conditions have improved in the past year,” Dudley said May 6. “Yet the recovery remains moderate and we still have a considerable way to go to meet the Fed’s dual mandate of full employment and price stability.” 

General Motors Co. (GM) said May 10 it will invest $2 billion in plants in eight U.S. states as it works to boost production and market share. About $1.8 billion of that investment would potentially create or save 4,000 jobs at 17 facilities, depending on completing local tax deals, the Detroit-based automaker said. 

Source: Bloomberg  

Read More......

Wednesday, May 11, 2011

Australian Trade Balance Outlook In This Week

BALANCE ON GOODS AND SERVICES

The trend estimate of the balance on goods and services was a surplus of $1,729m in March 2011, a decrease of $65m on the revised surplus in February 2011.

In seasonally adjusted terms, the balance on goods and services was a surplus of $1,740m in March 2011, a turnaround of $1,827m on the revised deficit in February 2011.

The sum of seasonally adjusted balances for the three months to March 2011 was a surplus of $3,203m, a decrease of $3,587m on the surplus of $6,790m for the three months to December 2010. However, if seasonal factors used in compiling the quarterly balance of payments are applied, the March quarter 2011 surplus was $3,486m, a decrease of $3,317m on the revised December quarter 2010 surplus of $6,803m.


EXPORTS OF GOODS AND SERVICES

Between February 2011 and March 2011 the trend estimate of goods and services credits rose $124m (1%) to $24,663m.

In seasonally adjusted terms, goods and services credits rose $2,106m (9%) to $24,991m. Non-rural goods rose $1,629m (11%) and non-monetary gold rose $503m (59%). Rural goods fell $60m (2%) and net exports of goods under merchanting remained steady at $26m. Services credits rose $33m (1%).


Exports of goods

GOODS CREDITS
Graph: Graph This graph shows the Trend and Seasonally adjusted estimate for Goods Credits


RURAL GOODS

In trend terms, exports of rural goods rose $44m (2%) to $2,523m.

In seasonally adjusted terms, exports of rural goods fell $60m (2%) to $2,532m.

The components contributing to the fall in the seasonally adjusted estimates were:
  • cereal grains and cereal preparations, down $33m (5%)
  • meat and meat preparations, down $32m (5%).

NON-RURAL GOODS

In trend terms, exports of non-rural goods rose $116m (1%) to $16,644m.

In seasonally adjusted terms, exports of non-rural goods rose $1,629m (11%) to $16,746m.

The main components contributing to the rise in the seasonally adjusted estimates were:
  • metal ores and minerals, up $891m (15%) after falling $614m (9%) the previous month
  • coal, coke and briquettes, up $387m (14%)
  • other mineral fuels, up $222m (12%)
  • other non-rural (incl. sugar and beverages), up $129m (15%).

For price and volume details, see the Selected commodities at the end of this section.

NET EXPORTS OF GOODS UNDER MERCHANTING

In trend terms, net exports of goods under merchanting remained steady at $26m.

In seasonally adjusted terms, net exports of goods under merchanting remained steady at $26m.

NON-MONETARY GOLD

In trend terms, exports of non-monetary gold fell $34m (3%) to $1,195m.

In seasonally adjusted terms, exports of non-monetary gold rose $503m (59%) to $1,352m.


Exports of services
SERVICES CREDITS
Graph: Graph This graph shows the Trend and Seasonally adjusted estimate for Services Credits


In trend terms, services credits fell $2m to $4,275m.

In seasonally adjusted terms, services credits rose $33m (1%) to $4,334m.

The main component contributing to the rise in the seasonally adjusted estimates was travel, up $19m (1%).

In seasonally adjusted terms, tourism related services credits rose $10m to $2,892m.


IMPORTS OF GOODS AND SERVICES

Between February 2011 and March 2011 the trend estimate of goods and services debits rose $189m (1%) to $22,935m.

In seasonally adjusted terms, goods and services debits rose $278m (1%) to $23,251m. Intermediate and other merchandise goods rose $623m (8%) and non-monetary gold rose $84m (25%). Capital goods fell $350m (8%) and consumption goods fell $66m (1%). Services debits fell $13m.

Preliminary analysis shows that, in seasonally adjusted terms, goods imports volumes increased 0.8% and the implicit price deflator increased 0.9% during the March quarter 2011. In original terms, both the Chain Laspeyres price index and the implicit price deflator increased 1.3%. The final volume and price outcomes will be published in the March quarter 2011 issue of Balance of Payments and International Investment Position, Australia (cat. no. 5302.0).


Imports of goods
GOODS DEBITS
Graph: Graph This graph shows the Trend and Seasonally adjusted estimate for Goods Debits


CONSUMPTION GOODS

In trend terms, imports of consumption goods fell $24m to $5,203m.

In seasonally adjusted terms, imports of consumption goods fell $66m (1%) to $5,178m.

The main components contributing to the fall in the seasonally adjusted estimates were:
  • textiles, clothing and footwear, down $58m (8%)
  • toys, books and leisure goods, down $27m (8%).

Partly offsetting these decreases was the non-industrial transport component, up $24m (2%).

CAPITAL GOODS

In trend terms, imports of capital goods rose $14m to $4,063m.

In seasonally adjusted terms, imports of capital goods fell $350m (8%) to $3,846m.

The main components contributing to the fall in the seasonally adjusted estimates were:
  • civil aircraft and confidentialised items, down $323m (51%)
  • machinery and industrial equipment, down $63m (5%).

Partly offsetting these decreases was the ADP equipment component, up $61m (10%).

INTERMEDIATE AND OTHER MERCHANDISE GOODS

In trend terms, imports of intermediate and other merchandise goods rose $204m (2%) to $8,427m.

In seasonally adjusted terms, imports of intermediate and other merchandise goods rose $623m (8%) to $8,907m.

The main components contributing to the rise in the seasonally adjusted estimates were:
  • fuels and lubricants, up $615m (23%). In original terms on a recorded trade basis, the crude petroleum component rose $533m (34%) with volumes up 24% and prices up 8%
  • parts for transport equipment, up $81m (11%)
  • organic and inorganic chemicals, up $78m (22%).

Partly offsetting these increases was the processed industrial supplied n.e.s. component, down $84m (4%).

NON-MONETARY GOLD

In trend terms, imports of non-monetary gold fell $33m (9%) to $340m.

In seasonally adjusted terms, imports of non-monetary gold rose $84m (25%) to $423m.


Imports of services
SERVICES DEBITS
Graph: Graph This graph shows the Trend and Seasonally adjusted estimate for Services Debits


In trend terms, services debits rose $27m (1%) to $4,901m.

In seasonally adjusted terms, services debits fell $13m to $4,897m.

The components contributing to the fall in the seasonally adjusted estimates were:
  • travel, down $25m (1%)
  • transport, down $10m (1%).

Partly offsetting these decreases was the maintenance and repair services n.i.e. component, up $18m.


Selected Commodities

Selected commodities, Price and volume analysis: Recorded Trade Basis

Oct 2010
Nov 2010
Dec 2010
Jan 2011
Feb 2011
Mar 2011
%
%
%
%
%
%

Iron ore

Lump
Volumes
10
-11
14
-15
-23
np
Price
-11
1
3
7
3
np
Fines
Volumes
7
-6
10
-16
-17
np
Price
-11
1
4
7
4
np

Coal

Hard coking
Volumes
-4
10
-6
-39
-7
39
Price
-6
-6
-
1
5
-
Semi-soft
Volumes
8
-5
3
-33
1
40
Price
-
-6
-2
-2
9
4
Bituminous (Thermal)
Volumes
-1
-19
15
-10
-20
3
Price
-6
-
2
5
2
-

- nil or rounded to zero (including null cells)
np not available for publication but included in totals where applicable, unless otherwise indicated


On a recorded trade basis, between February and March 2011, large value increases were recorded for the following selected commodities:
  • hard coking coal rose $415m (39%) with exports to Republic of Korea up $123m and India up $99m (27%), both driven by an increase in volumes
  • semi-soft coal rose $226m (45%) with exports to Republic of Korea up $126m and Japan up $50m (21%), both driven by an increase in volumes.
Source: Australian Bureau of Statistics

Read More......

Gold, Silver Extend Advance on China’s Inflation, European Debt Concerns

Gold gained for a fourth day in London as concern about inflation and Europe’s debt woes spurred demand for precious metals as a protection of wealth. Silver rose. 

China’s consumer prices rose 5.3 percent in April from a year earlier and have exceeded the government’s target each month this year, data showed today. The euro was little changed against the dollar amid speculation European leaders are slowing the drive to grant Greece additional aid, fueling concern the nation may be forced to restructure its debt. 

“We still have unresolved issues with the euro zone,” said Bernard Sin, the head of currency and metal trading at MKS Finance SA, a bullion refiner in Geneva. “In the long term, it may be sensible to hedge against inflation with gold. Physical demand is extremely good” from India, he said. 

Immediate-delivery gold rose $9.53, or 0.6 percent, to $1,525.80 an ounce by 9:41 a.m. in London. Prices reached a record $1,577.57 on May 2 before slumping 4.4 percent last week. Gold for June delivery was 0.6 percent higher at $1,525.40 an ounce on the Comex in New York

China’s inflation was more than the 5.2 percent median forecast in a Bloomberg survey of 30 economists and compared with a 5.4 percent increase in March. The government aims to limit inflation to 4 percent this year, and has raised interest rates four times since October to cool growth. Inflation in Germany accelerated more than initially estimated in April, data showed today.

‘Appetite’ for Gold

“Signs of continued pressures might see the market’s preoccupation with rising global inflation resurface, and consequently see some inflation-hedge demand,” Marc Ground, an analyst at Standard Bank Plc, wrote in a report. “With the resurfacing of euro-zone sovereign-debt concerns, we expect to see continued appetite for gold and silver.” 

Standard & Poor’s this week downgraded Greece’s credit rating for the fourth time since April 2010, signaling that the region’s debt crisis is escalating. European leaders slowed the country’s drive for extra aid, saying the government in Athens must first make good on pledges to overhaul an economy mired in a three-year recession. 

UBS AG’s gold sales to India so far this year are more than 10 percent higher than in the same period last year, London- based analyst Edel Tully said today in a report. India is the biggest buyer of bullion. 

Silver for immediate delivery gained 1.9 percent to $39.2525 an ounce. The metal for July delivery climbed 2 percent to $39.255 an ounce on the Comex.

Silver Assets Gain

Silver futures slumped 27 percent last week, the worst weekly drop since at least 1975, as investors sold commodities from oil to copper and exchange owner CME Group Inc. (CME) increased the cost of making new speculative positions. Prices slid as much as 34 percent since reaching a 31-year high of $49.845 an ounce on April 25. A bear market is defined by some investors as a decline of 20 percent or more. 

Silver assets held in exchange traded products rebounded from a six-month low, gaining 208.03 metric tons, or 1.5 percent, to 14,399.24 tons, data compiled by Bloomberg show. Assets dropped 7.6 percent in the six days through May 9. Gold ETP holdings fell 4.49 tons, or 0.2 percent, to 2,050.15 tons yesterday, data showed. 

Palladium for immediate delivery gained 0.6 percent to $734.50 an ounce. Platinum rose 0.4 percent to $1,803.63 an ounce. 

Source: Bloomberg  

Read More......

Monday, May 9, 2011

Weekly Analysis of 5 Major Currency


Last week, 5 major currency had increased in a good position which is where some indicators fundamental gave tremendous impact. From 1-7 may 2011, I will summarize what had been happened along this week and help to trader by analyzing both technical and fundamental factors. To get more detail refer to forexfactory 

Technical

EUR/USD, Retail Sales m/m was bad from 0,25% (forecast) to -1,0% (actual), German Factory Orders m/m dropped sharply from 0,4% to -4,0%, Minimum Bid Rate was still the same 1,25%, ECB Press Conference , German Industrial Production m/m rose slightly from forecast 0,6% to actual 0,7%


AUD/USD, HPI q/q dropped from 0,3% to -1,7% , Cash Rate remain unchanged 4,75%, AIG Services Index was good 51,5 compare with previous 46,5, HIA New Home Sales m/m increased from 0,6% to 4,3% , Building Approvals m/m rose sharply 5,5% to 9,1%, Retail Sales m/m was bad from 0,6% to -0,5%, RBA


GBP/USD, BOE Gov King Speaks, Manufacturing PMI dropped from 57,0 to 54,6, CBI Realized Sales showed a good result about 21 compare with previous 15, Nationwide HPI m/m reduced from 0,3% to -0,2%, Construction PMI dropped from 55,6 to 53,3, Net Lending to Individuals m/m was not good from 1,7B to 0,5B, Services PMI was bad from 55,8 (forecast) to 54,3 (actual), Asset Purchase Facility was remain unchanged about 200B, Official Bank Rate still the same about 0,50%, PPI Input m/m rose from 1,7% to 2,6%,


USD/JPY, Average Cash Earnings y/y was not good from -0,1% to -0,4%, along this week there have no much indicator that can be used to gauge yen currency mover.


USD/CHF, Retail Sales y/y was still bad which dropped from 2,3% to 0,2%, SVME PMI fell slightly from 58,8 to 58,4, Unemployment Rate rose just a little from 3,2% to 3,1%


Fundamental

EUR, two important indicator ECB and minimum bid was the most influence in this week. President Jean- Claude Trichet today may indicate just how fast he’s prepared to raise interest rates over the coming months. Monetary policy elsewhere is becoming tight and for ECB stetment can be read here. Moreover, if we look AUD, The rising exchange rate will be helping to hold down prices for some consumer products over the coming few quarters. Senior economist at RBC Capital Markets in Sydney who predicts the central bank’s next rate increase will be in October (). At this time, diseaster in "Widespread flooding in the eastern states, particularly Queensland, and other recent natural disasters have not adversely affected participation by providers in the Building Approvals collection or the quality of estimates in this release," the ABS said in a statment. Reserve Bank of Australia Governor Glenn Stevens has paused raising interest rates for the past five meetings to help Queensland state recover from damage to properties, mines and crops from floods and a cyclone. There is a lot of uncertainty over households. RBA also Sees Need for Higher Rates ‘At Some Point’ to Slow Australia Inflation. For GBP, There is raft of evidence showing the UK housing market is suffering from historically low levels of activity. Mortgage approvals have been running around half long run averages. The economy stalled over the fourth and first quarters, and surveys this week showed services, manufacturing and construction growth moderated in April. Officials, who will publish new growth and inflation forecasts next week, are split on the threats from government spending cuts and inflation that’s double the central bank’s 2 percent target. “The outlook for growth is tepid and the committee may not do anything until November,” said David Tinsley, an economist at National Australia Bank in London and a former central bank official. Worsening economic data may ease pressure on the Bank of England to raise rates to curb inflation, which has soared to more than twice the central bank’s 2 percent target. "The service sector suffered a sharp loss of growth momentum at the start of the second quarter. The survey's measure of business activity showed the second-largest fall since October 2008, exceeded only by the sector's weather-related slide back into contraction in December," Chris Williamson, chief economist at Markit said. The rising cost of crude oil and imported goods pushed input price inflation to its highest level for two and half years in April. Instead of he impact of the rise in clothing and footwear prices. For JPY, no many fundamental factorthat we can analyze for yen currency, one of may impact yen currency mover is average cash earning which showed that Japan March wages fall first time in 13 months after quake instead of two other disaster tsunami and nuclear. These factors also affect crisis hurt jobs as well as income. Furthermore, factor that affect CHF currency are Sales of food, beverages and tobacco declined 1.3 percent, while non-food sales excluding fuel rose 2.6 percent  so that retail sales declined. In addition, falls in the output and backlog of orders subcomponents must be consider as well.

In conclusion, I strongly suggest to pay more attention in which where I give bold some important indicators above before making a decision, because those indicator will definitely influence of currency mover. Along this week, 5 major currency dropped gradually toward USD, this because of bad result of fundamental factors.

Read More......
Related Posts Plugin for WordPress, Blogger...